Making a spectrogram with GD3X
Increasingly the Gameduino 3 (and the new 3X) are being used by people for controls and visualization. Many of the questions I get these days come from people using it as a UI for instruments. So when I got a mail yesterday asking about how to make a color spectrogram display like this one I couldn't resist hacking together a short demo.
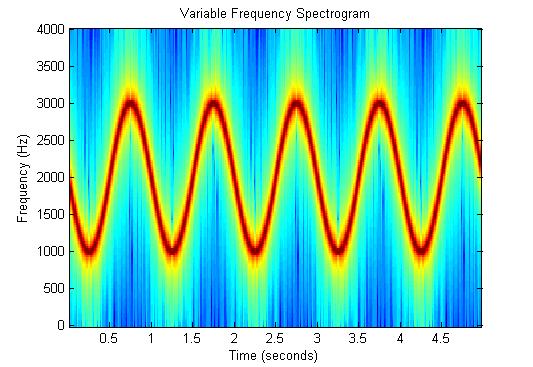
The display scrolls continuously; new data appears on the edge. The color of each line shows how much energy is at a particular frequency. The above example scrolls left-to-right, but in the demo it scrolls upwards; this layout is more commonly used in instrumentation.
(The demo runs on a GD3 or GD3X driven by a SPIDriver with an Arduino shield adapter. The code is in Python, but should translate line-for-line to C; the Python and C Gameduino APIs are the same. It will run on CircuitPython as well.)
The first step is to load a 256x1 bitmap with the color gradient. This is a single png file, loaded at address zero in graphics memory like this:
    eve.cmd_loadimage(0, 0)
    eve.c(align4(open("jet.png", "rb").read()))
Using this color gradient as a bitmap's palette means that every byte in the bitmap is a pixel, with 0 as dark blue and 255 as deep red. This keeps things simple for the CPU. Setting up the 256x256 bitmap is done with:
    a = 512
    eve.cmd_setbitmap(a, gd3.PALETTED565, 256, 256)
and it can be drawn with:
        eve.Clear()
        eve.Begin(gd3.BITMAPS)
        eve.Vertex2f(112, 10)
        eve.swap()
Because BT815 memory is initialized to 0xff at reset, the whole 256x256 bitmap is deep red. We can draw any pattern of bytes into it, and see the color LUT loaded from jet.png. For example:
        for x in range(256):
            for y in range(256):
                v = int(255 * math.sqrt((x / 256) ** 2 + (y / 256) ** 2) / math.sqrt(2))
                eve.wr(a + 256 * y + x, bytes([v]))
or loading a 256x256 monochrome image to the same memory gives an Andy Warhol effect:
The hardware has a 2D transformation matrix that is applied to all bitmaps. Setting the Y translate component causes the bitmap to move downwards and wrap, like this:
eve.BitmapTransformF(256 * 77)
So by loading horizontal strips of pixels and setting this rotate register, the MCU can draw a continuously scrolling false-color strip. Putting it all together we have:
    def redraw(y, linedata):
        eve.Clear()
        eve.Begin(gd3.BITMAPS)
        eve.BitmapTransformF(256 * ((y - 254) & 0xff))
        eve.Vertex2f(112, 10)
        eve.swap()
        eve.cmd_memwrite(a + 256 * y, len(linedata))
        eve.c(linedata)
and running it for a few cycles with made-up data produces the desired upwards-scrolling display:The complete demo is at:https://github.com/jamesbowman/gd2-asset/blob/master/pydemo/specgram.py